
As someone who studies markets through the lens of history rather than credentials, SpaceX’s (SPCX) first weeks as a public company look less like a surprise and more like a pattern we’ve seen many times before (just this month’s MSFT prediction).
Key Takeaways
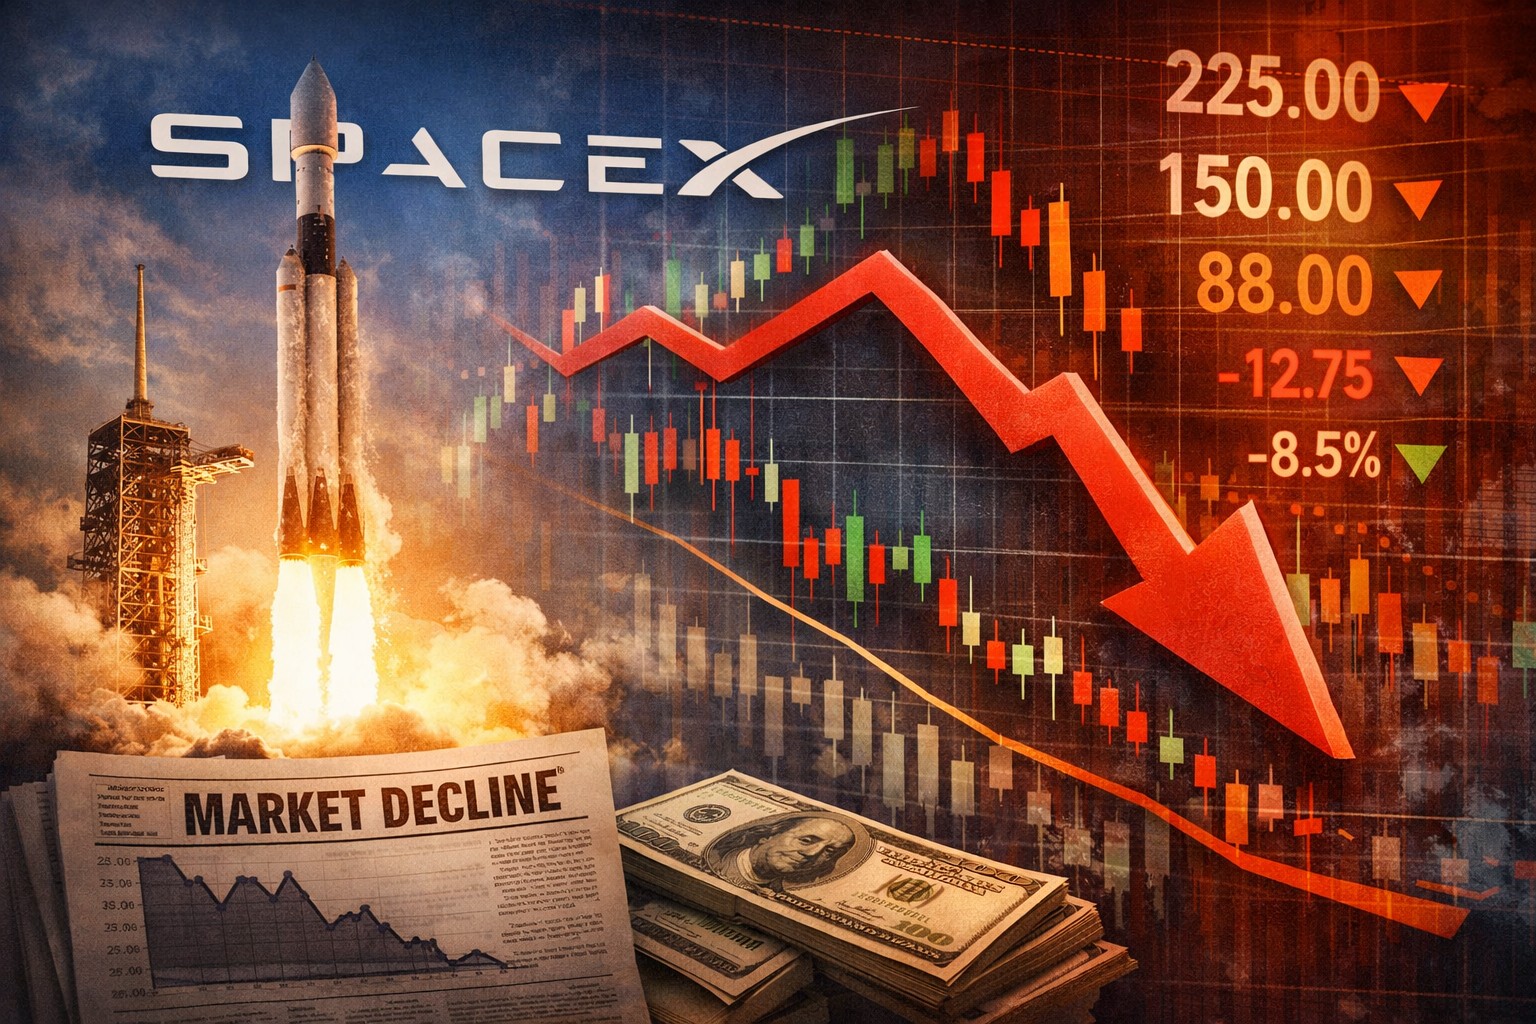
- SpaceX surged nearly 20% on its first trading day, hitting a peak of $225 after debuting at $150.
- There’s a historical pattern that follows this type of opening.
- The company raised over $85 billion in the world’s largest IPO after exercising its overallotment option.
- The IPO was heavily oversubscribed.
More Details
1. SpaceX’s Stock Performance
- SpaceX surged nearly 20% on its first trading day, hitting a peak of $225 after debuting at $150.
- The stock has since fallen below its debut price, losing early momentum in recent days.
2. What History Suggests for Investors
- Based on typical post‑IPO behavior, a $10,000 investment in SpaceX today would historically be expected to be worth about $8,800 after one year—reflecting common declines after major IPOs.
3. Why Investors Are Interested
- SpaceX’s appeal comes from its mix of rocket launches, satellite internet, AI initiatives, and long‑term ambitions like Mars colonization—all driven by Elon Musk’s leadership and vision.
- The company raised over $85 billion in the world’s largest IPO after exercising its overallotment option.
4. IPO Demand and Early Trading
- The IPO was heavily oversubscribed, with strong demand from both retail and professional investors.
- The stock climbed 50% from its debut price to its early peak before reversing course.
SpaceX Slips Below Its Debut Price, but the Pattern Is Bigger Than the Stock
SpaceX exploded out of the gate, jumping nearly 20% on day one and eventually running all the way up to $225 — a full 50% above its $150 debut price. That kind of enthusiasm isn’t unusual when a company with a big narrative finally becomes accessible to everyday investors. In this case, demand was enormous; the IPO was heavily oversubscribed, and the company raised more than $85 billion, making it the largest IPO ever.
For years, SpaceX was making headlines for its NASA launches — and with Musk also running Starlink, X, and Grok, investor attention has only grown.
So it wasn’t new to investors.
But markets have a way of cooling off once the initial excitement fades. And that’s exactly what happened. In recent days, SpaceX has slipped back below its debut price, giving up the early momentum it enjoyed in mid‑June.
From a historical standpoint, this isn’t shocking.
Most major IPOs experience a pullback after the first wave of demand settles. According to the data referenced in the article, a hypothetical $10,000 investment in SpaceX today — based purely on typical post‑IPO behavior — might be worth something closer to $8,800 a year from now.
That’s not a prediction, just a reminder that markets often behave in cycles, and IPOs tend to follow their own well‑worn script.
>> SEE ALSO: Google’s $94B bet collapsed with SpaceX IPO
None of this takes away from SpaceX’s long‑term potential. The company sits at the intersection of several massive industries: rocket launches, satellite internet, AI, and even the long‑shot dream of Mars colonization. Investors aren’t just buying a stock — they’re buying into a vision, and Elon Musk’s track record has a way of amplifying that interest.
But as a student of markets, I’ve learned that even the most exciting companies still move through familiar phases. SpaceX’s early trading is a reminder that hype can push prices up quickly, history can pull them back down just as fast, and the real story unfolds over years, not weeks.
Stock Info: SPCX
Space Exploration Technologies Corp.
$136.08 (Closing 7/14/2026)
Mkt Cap 1.79T
Vol: 486.81k

High‑Growth IPOs That Dropped Early — Then Exploded in Value
1. Amazon (IPO: 1997)
- Early drawdown: Within two years of its IPO, Amazon fell more than 80% during the dot‑com crash.
- Recovery: Investors who held through the volatility saw Amazon rise more than 300x over the next two decades.
- Relevance: Amazon’s early crash didn’t reflect its long‑term trajectory — a classic example of how transformative companies behave after going public.
2. Tesla (IPO: 2010)
- Early drawdown: Tesla dropped roughly 35–40% in its first year as public markets questioned its production capacity and profitability.
- Recovery: Over the next 10 years, Tesla delivered returns exceeding 20,000%, turning a $10,000 investment into well over $2 million.
- Relevance: Tesla shows how early skepticism often precedes massive long‑term gains in frontier industries.
3. Nvidia (IPO: 1999)
- Early drawdown: Nvidia lost more than 50% of its value shortly after IPO during the tech downturn. $0.31 to $0.13 in 2000.
- Recovery: Over the following 20+ years, Nvidia became one of the best‑performing stocks in history, compounding at rates that turned $10,000 into millions.
- Relevance: Market cycles punish innovators early, but reward them heavily once their technology becomes foundational.

4. Google (IPO: 2004)
- Relevance: Even “sure things” experience early volatility that doesn’t reflect long‑term value creation.
KEY NOTE: long‑term performance, not early volatility. - Early drawdown: Google dipped ~15–20% in its first months as analysts questioned valuation.
- Recovery: Over the next decade, Google delivered more than 2,000% returns.
According to Motley Fool
Among the 10 largest U.S. IPOs in the last decade, the median stock fell 17% from its IPO price during its first year on the public market. SpaceX priced its IPO at $135 per share. If its performance matches the historical median, the stock will trade at $112 per share by June 2027 (i.e., 17% below its IPO price). That implies 13% downside from the current share price of $129.
What can we learn from history that applies to SpaceX (SPCX)?
- Innovators often face skepticism immediately after IPO.
- Early volatility is normal — not predictive.
- Long‑term returns depend on execution, not early market sentiment.
- A $10,000 investment in a transformative company often becomes life‑changing over a decade.

Sources
- Amazon.com, Inc. (1997, March 24). Form S‑1 registration statement under the Securities Act of 1933. U.S. Securities and Exchange Commission.
https://www.sec.gov/Archives/edgar/data/1018724/0000891618-97-001309.txt - Amazon.com, Inc. (1997, May 15). Prospectus (Form 424B1) – 3,000,000 shares of common stock. U.S. Securities and Exchange Commission.
- Cimino, Adria. “SpaceX fell below its debut price. History says a $10,000 investment will be worth this much in a year.” The Motley Fool, published on MSN.
- MarketWatch Staff. Space Exploration Technologies Corp. (SPCX) — Stock Quote, News, and Financials. MarketWatch.
- Nasdaq. (2020). Tesla, Inc. (TSLA) historical stock prices. Nasdaq Data Services.
https://www.nasdaq.com/market-activity/stocks/tsla/historical - StatMuse. (2024). GOOGL annual return history. StatMuse Money. https://www.statmuse.com/money/ask/googl-annual-return-history
- StatMuse. (2026). NVDA annual return history. StatMuse Money. https://www.statmuse.com/money/ask/nvda-annual-return-history
- Tesla Motors, Inc. (2010). Prospectus: 13,300,000 shares of common stock (Form 424B4). U.S. Securities and Exchange Commission. https://www.sec.gov/Archives/edgar/data/1559720/000119312520315318/d81668d424b4.htm
- WSJ Markets. Space Exploration Technologies Corp. (SPCX) — Stock Price, Charts, and Company Information. The Wall Street Journal.
- Yahoo Finance Editorial Team. SPCX — Space Exploration Technologies Corp. Stock Summary, Chart, and Key Statistics. Yahoo Finance.



Leave a Reply